
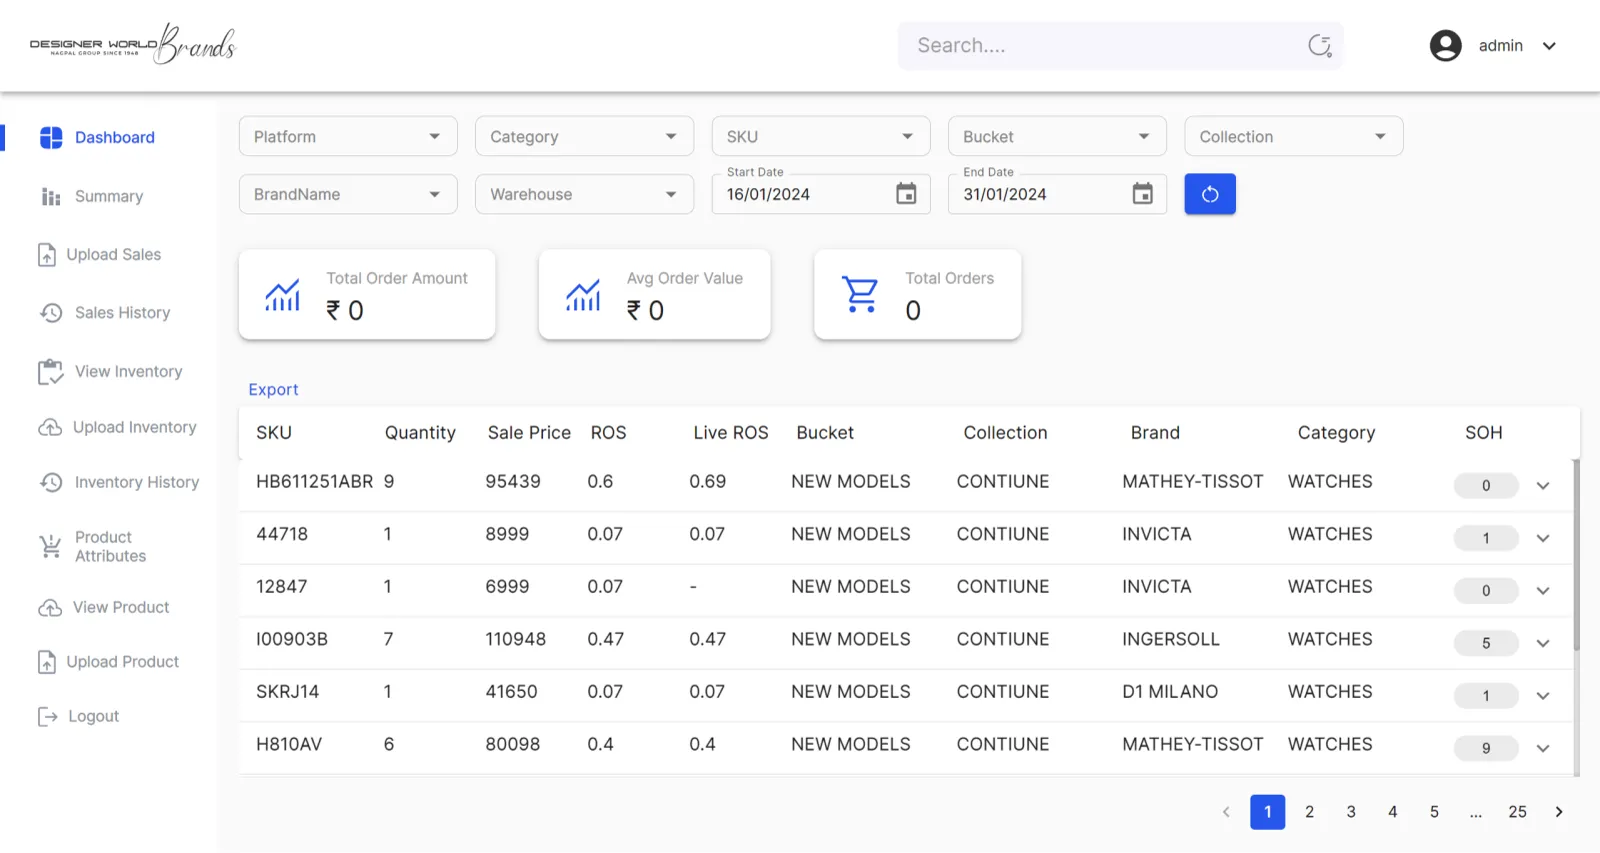
A pan-India watch distributor sees what sells, what sits in stock, and where, from a dashboard Idealite built.
{ Project Overview }
About the Project
Designer World Brands, the Nagpal Group's Mumbai distribution arm, imports and exclusively distributes international watch and clock brands such as Mathey-Tissot, Invicta and Ingersoll. It says it manages more than 20 global brands and supplies over 100 retail partners across India. With many models spread across several sales channels and warehouses, the team needed to know which were moving, how much stock each location held, and which channels drove demand. Imported stock ties up capital, so a late reorder on a fast seller and a shelf of slow models both cost money. Buyers and managers can now see each model's sales pace beside its stock, by brand, channel, warehouse and date, and check order value and volume for any period. Idealite built the private sales and stock dashboard that gives the internal team this view.
- Industry
- Inventory Management
- Services
Web App Development • Sales & Inventory Reporting • Product Data Management
{ The Challenge }
Many Brands, Many Channels, Capital in Stock
Key Challenges
- Sales and stock data kept apart
- Fast sellers at risk of stockouts
- Slow models tying up import capital
- No quick read on order value
- Reports needed like-for-like product data
{ Our Solution }
Buying Decisions Backed by Sell-Through
- Reorder on real demand
- Spot slow movers
- Headline sales figures
- Compare brands and warehouses
- Like-for-like reporting
- Reports ready to share
{ How We Built It }
Development Process
How the Designer Watches LLP engagement came together, step by step.
- 01
Understand the Trade
Mapped how the distributor moves brands through sales channels and warehouses, and which buying decisions the numbers had to support.
- 02
Agree on One Language
Aligned how brands, collections and product groups are named, so every report compares like with like.
- 03
Bring Sales and Stock Together
Gave the team one place to load sales and stock data, with a record of what was loaded and when.
- 04
Support Buying Decisions
Put each model's sales pace beside its stock, by brand, channel and warehouse, so buying calls follow actual demand.
{ Results & Impact }
Delivering Business Value
One Shared View
Sales and stock across brands, sales channels and warehouses sit on one screen.
Demand-Led Buying
Buyers check each model's sales pace and stock before reordering or importing.
Self-Serve Numbers
Management checks order value and volume for any brand, channel or period.
Traceable, Shareable Reports
Teams know which data a report uses and can share it.
Technical details
Requirements, architecture, development, testing and deployment notes.
Technical details
Requirements, architecture, development, testing and deployment notes.
Objectives
- Sales and Stock Together: See sales and stock for brands, sales channels and warehouses side by side.
- Buy on Sell-Through: Show each model's sales pace beside its stock, so reorder and import decisions follow demand.
- Headline Numbers on Demand: Let management check order value, average order value and order count for any brand, channel, warehouse or period.
- Consistent Product Data: Keep brand, collection, category and product groupings consistent so every report compares like with like.
- Trusted Source Data: Keep a record of each sales and inventory upload so the team knows what a report is based on.
Requirements
- Login-protected access for the client's internal team, with an admin account.
- Sales uploads (Upload Sales) with a Sales History log of past uploads.
- Inventory uploads and views (Upload Inventory, View Inventory) with an Inventory History log.
- Product catalogue (Upload Product, View Product, Product Attributes) holding brand, collection, category and bucket for each SKU.
- Dashboard filters for platform, category, SKU, bucket, collection, brand, warehouse and a start and end date.
- Headline cards for Total Order Amount, Average Order Value and Total Orders.
- Paginated SKU table showing quantity sold, sale price, ROS, Live ROS, bucket, collection, brand, category and stock on hand (SOH), with export.
- A separate Summary view.
Architecture
- Login-only web application with separate modules for the dashboard, summary, sales, inventory and product data.
- Data comes in by upload: sales, inventory and product data arrive as file uploads, and each upload is logged in a history view.
- Sales and stock are reported per SKU against a shared product catalogue, so the brand, collection, category and bucket filters apply to both.
Front end
- Sidebar navigation across the Dashboard, Summary, sales, inventory and product modules.
- Filter bar of dropdowns plus a date-range picker that refreshes the dashboard.
- Headline KPI cards and a paginated, exportable SKU table with a per-row expand control.
Back end
- Stores uploaded sales, inventory and product data and keeps a history of each upload.
- Returns order totals, average order value, order counts and per-SKU sales, rate of sale and stock on hand for the selected filters.
Challenges & solutions
- Matching sales and inventory uploads from different platforms and warehouses to the same SKU, so sales and stock can sit side by side.
- Keeping brand, collection, category and bucket attributes consistent so that filtered totals add up.
- Calculating rate of sale per SKU for any date range and filter combination.
Outcomes
- Shared view: sales and stock across brands, sales channels and warehouses on one screen.
- Demand-led buying: each model's sales pace beside its stock shows fast sellers to restock and slow models to push.
- Self-serve answers: filters by brand, collection, category, product group, channel, warehouse and date answer common questions without a custom report.
- Shareable results: any filtered list can be exported and shared.
- Traceable data: sales and inventory upload histories show what was loaded and when.
Next case study
Supporting Nike's Global View of Launches and Store Stock
{ Let's Build Together }
Let's build what's next
We partner with ambitious businesses to design, build and scale digital products that create lasting value.
Contact Us